More Canadian than American: the surprising default values of five leading AI models
We often assume that because major AI models are built by US tech giants and trained on American-dominated data, they default to American cultural and political values. At Transformer Lab, we put that assumption to the test with a controlled audit that compared model answers on subjective value questions against real survey responses from the US and Canada. The result was the opposite of what we expected: top language models are actually more biased toward giving Canadian-like answers. 🇨🇦
We audited five frontier and open-weight models (GPT-4o, Claude Opus 4.8, Grok 4.3, Llama-3.1, and Qwen2.5) against actual human data from the World Values Survey: the real, survey-weighted answers of 2,596 American and 4,018 Canadian respondents. As far as we can tell, it is the first study to compare US and Canadian values in language models directly. Three findings defy the standard "US-centric default" narrative:
- The Canadian lean. In 69% of statistically significant comparisons (57 of 83, out of 112 run), a model's default answer distribution landed closer to Canadian public opinion than American. Each comparison was stress-tested with 2,000 bootstrap resampling iterations, over 200,000 statistical tests in all. Every single model leaned Canadian.
- Institutional trust. The Canadian bias is strongest when models answer questions about trust in government, immigration, and national identity. It fades to a dead heat on religion and actually reverses on interpersonal trust.
- The refusal gap. Claude Opus 4.8 refused to state a zero-shot opinion every single time, and GPT-4o refused often, a compliance gap that traditional AI bias audits miss entirely. But Grok 4.3, just as closed and frontier, answered as readily as the open-weight models: refusal tracks the individual model, not open-versus-closed.
The test
There is no neutral place to stand on questions of trust, religion, or confidence in government: real people in different countries answer them differently, so a model's "default" opinion is always somebody's opinion. To find out whose, we focused on ten World Values Survey questions where American and Canadian respondents genuinely diverge, covering trust, religion, gender attitudes, work ethic, confidence in government, corruption, immigration, and national pride. Each question was presented to the models verbatim from the WVS questionnaire.
Each model answered every question three ways: with no persona, as "an average American," and as "an average Canadian." We then measured which country's real answer distribution the model's answers sat closer to, running 2,000 bootstrap resampling iterations per comparison to separate genuine leans from survey sampling noise. Canada makes this a deliberately hard test: it is English-speaking, high-income, and culturally about as close to the US as any country gets, so any consistent lean between the two is meaningful.
Every model leans Canadian
Across the 112 multiple-choice comparisons, 83 were statistically significant. Of those 83, 57 (69%) placed the model closer to the Canadian distribution, and 26 (31%) closer to the American one. The pattern held in every model, survived a false-discovery-rate correction, and grew slightly stronger when the least reliable cells were dropped.
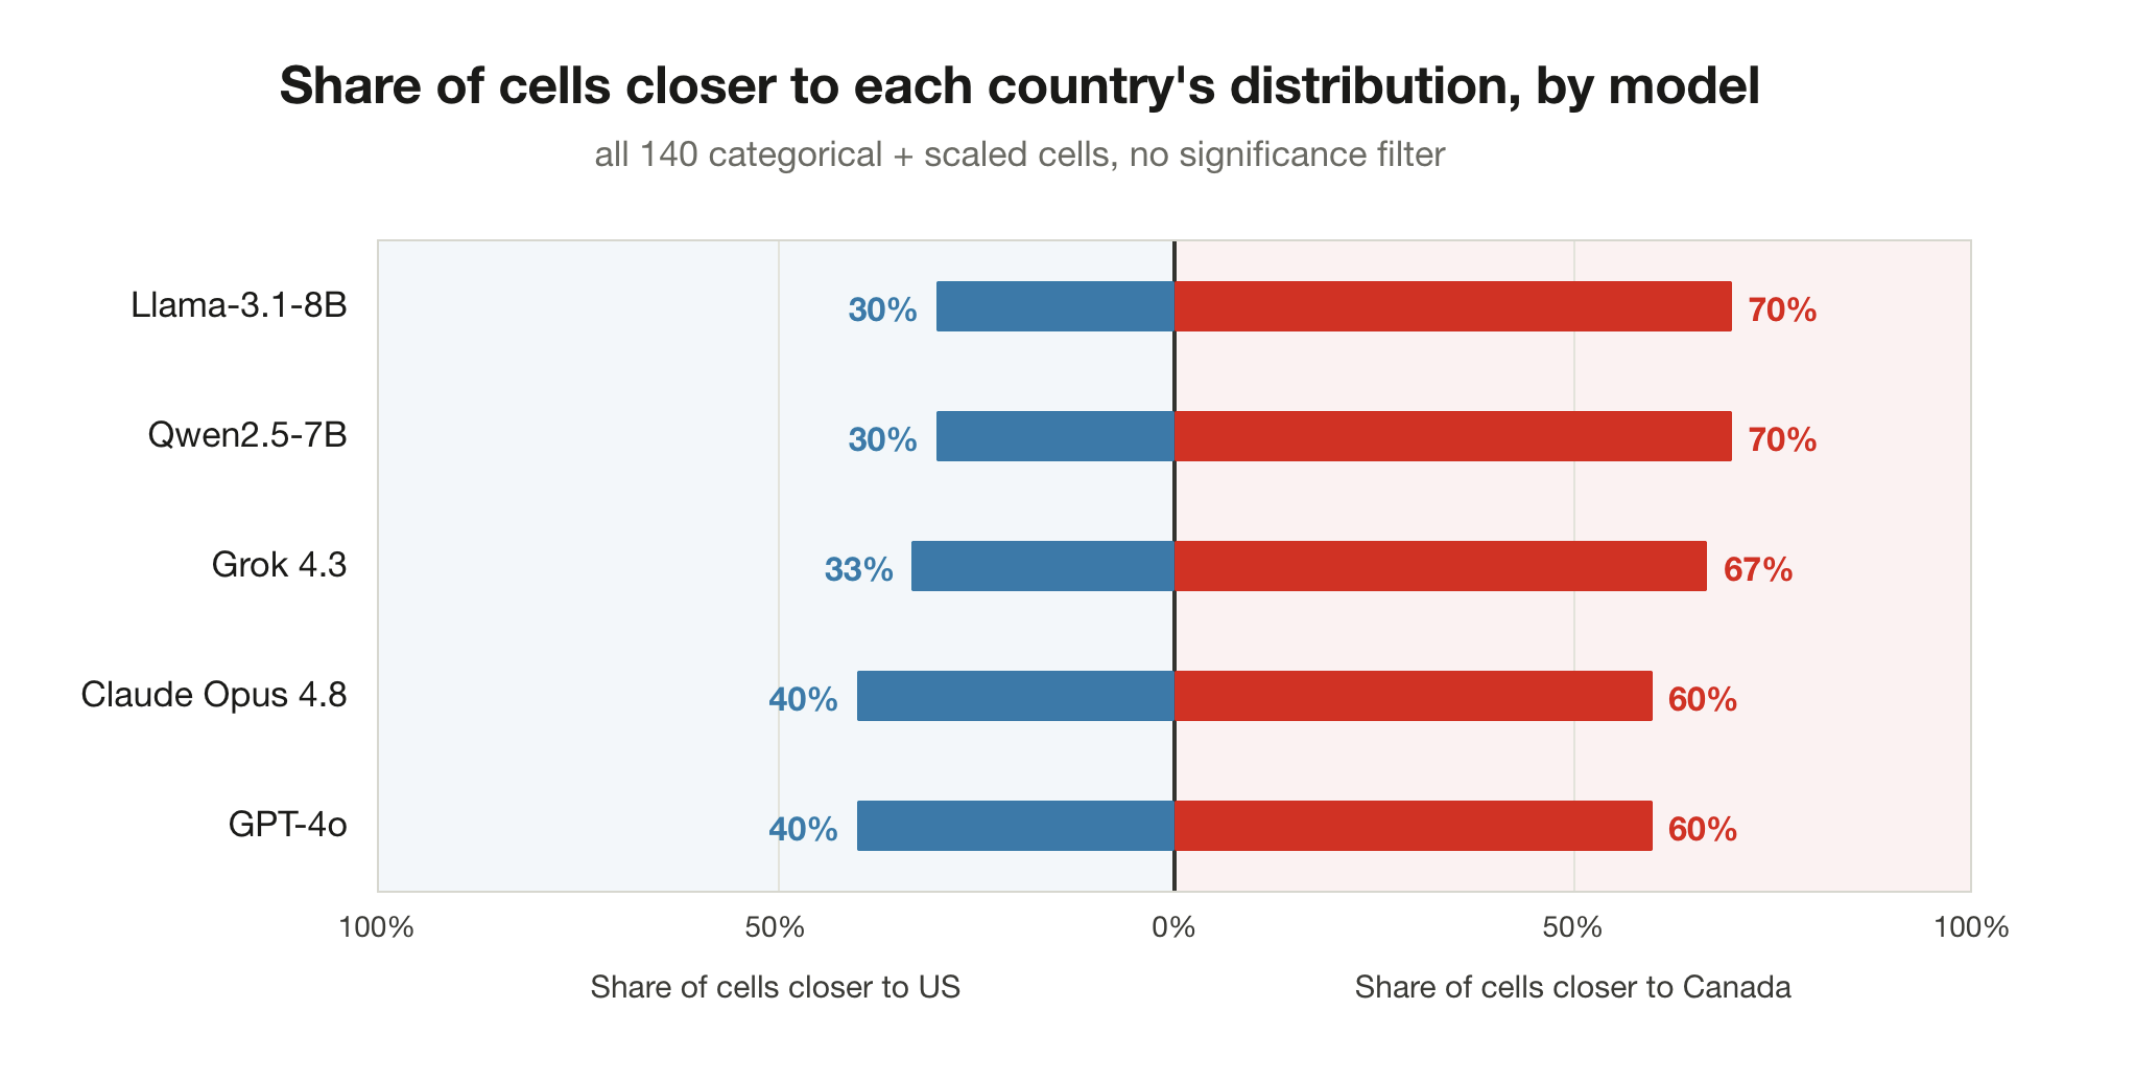
Pooling every cell we measured (all 140 comparisons, before any significance filter), every model lands majority-Canada, from 60% for GPT-4o and Claude to 70% for the two open-weight models. The two open-weight models were trained completely independently, one by Meta and one by Alibaba, which argues against pinning the pattern on any single company's training pipeline.
Strongest on institutions, reversed on trust
The lean is not uniform across topics, and where it concentrates tells you more than the headline number:
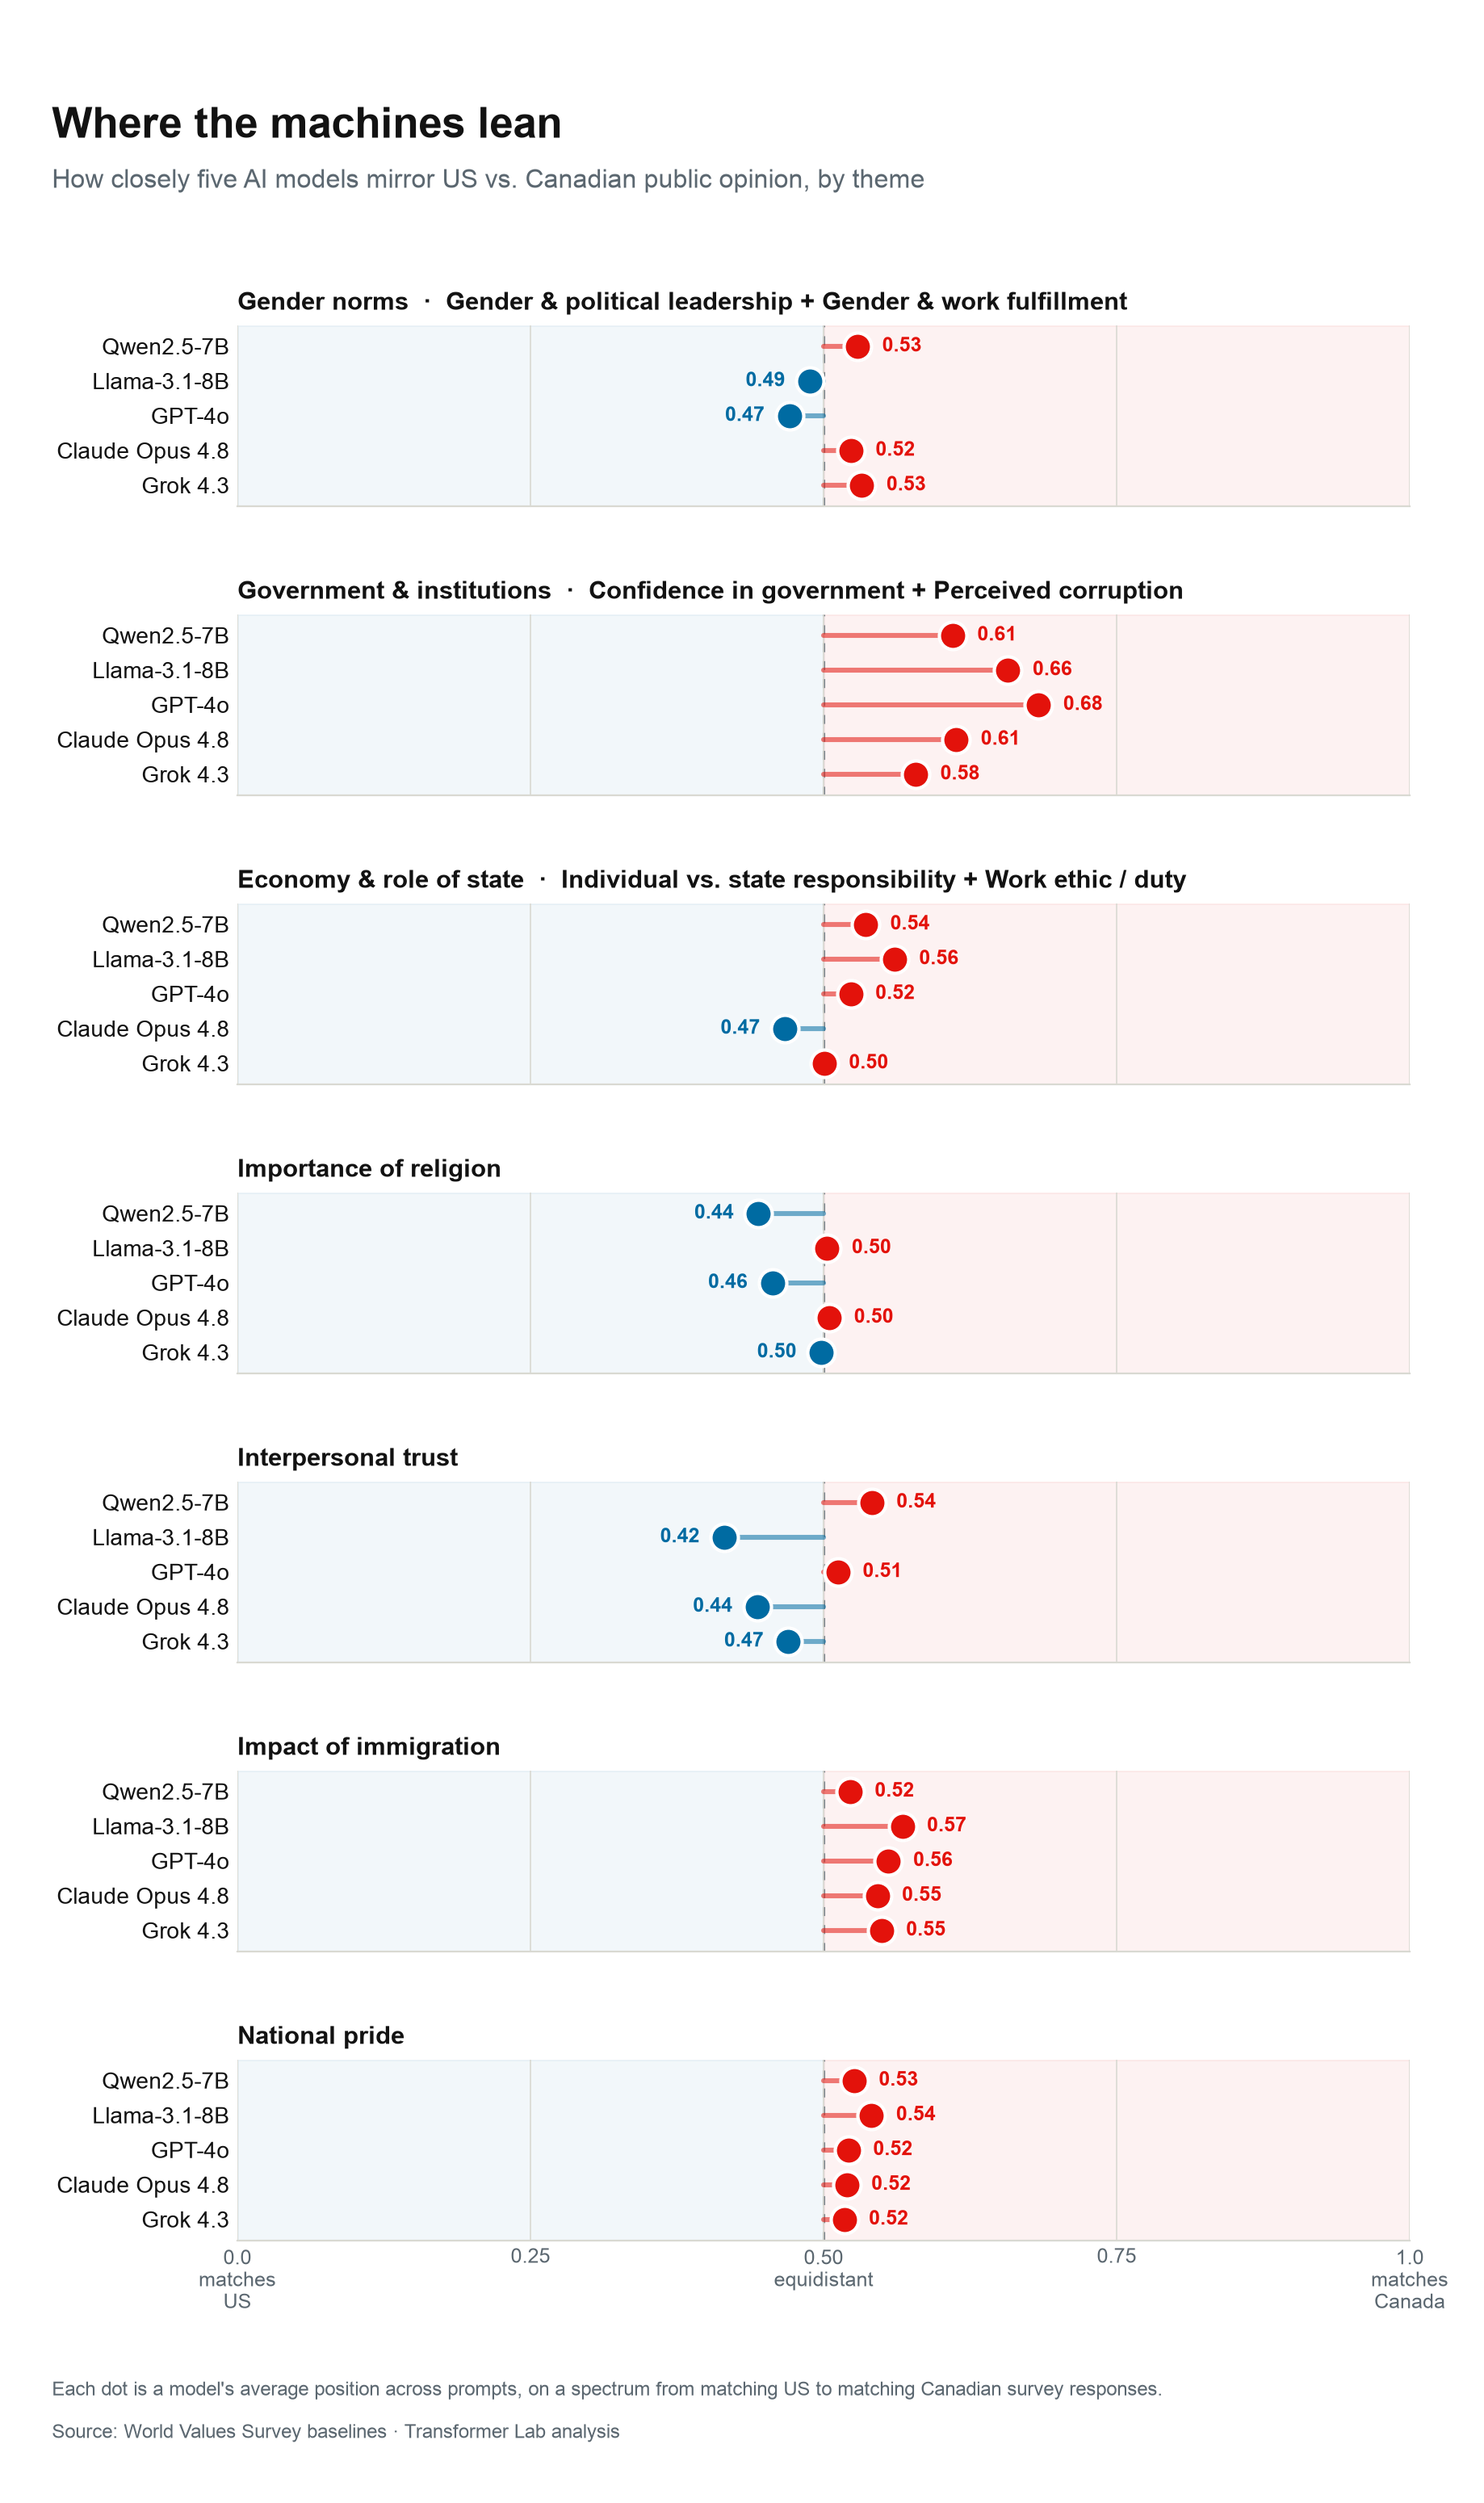
The Canadian lean is strongest on government, institutions, and national pride, where all five models lean the same way. Religion is a near-tie, even though it is the question where the two real populations differ most (37% of Americans call religion "very important" against 15% of Canadians). And interpersonal trust reverses: three of the five models lean American there, likely because safety training makes these systems cautious about strangers, and the American baseline happens to be the more distrustful one (62.8% of US respondents say you can't be too careful, against 53.3% of Canadians).
Two smaller findings round out the picture. Telling a model to "answer as a Canadian" genuinely steers it: eight of nine testable cases shifted significantly, with Grok 4.3 sliding from 6.50 to 3.10 on the ten-point perceived-corruption scale. The one holdout, Qwen on state responsibility, would not move under any framing. And the refusal gap deserves its own caution: if one model refuses the bare question and another answers it, a bias audit that ignores willingness to answer can mistake a refusal for neutrality.
Why? The data doesn't say, but we have a theory
Our study measures where the models lean, not why they lean that way. But we do have suspicions.
The explanation we find most compelling is that we are looking at the values of the people who aligned these models, not the raw internet text underneath them. Recent work by Bladon and Bent (2026) argues that cultural bias in language models originates primarily in post-training, not pretraining. The annotators and developers steering that process tend to be highly educated tech workers whose collective preferences — tolerance, diplomacy, trust in institutions — may map closer to average Canadian opinion than to the polarized American public.
Or, put more simply: nobody programs a model to be Canadian. But when a Silicon Valley company sets out to make one perfectly polite, universally tolerant, highly trusting of institutions, and afraid of ever saying anything too extreme, it may end up building a Canadian by accident.
One explanation the data does rule out is blank neutrality. A perfectly flat dummy distribution, encoding nothing about either country, lands closer to the US on 5 of 8 items, the opposite of what the models do. Whatever produces the lean, it is learned.
The full research data and code are available at github.com/transformerlab-research/us-canada-llm-bias-audit: the elicitation pipeline, the analysis scripts, and every derived result file (MIT / CC BY 4.0). The full paper is linked in the research gallery above.
Survey data credit: Human baselines come from the World Values Survey: Haerpfer, C., Inglehart, R., Moreno, A., Welzel, C., Kizilova, K., Diez-Medrano, J., Lagos, M., Norris, P., Ponarin, E. & Puranen, B. (eds.), 2022. World Values Survey: Round Seven — Country-Pooled Datafile Version 6.0. Madrid, Spain & Vienna, Austria: JD Systems Institute & WVSA Secretariat. doi:10.14281/18241.24